Web Inspector on iOS devices and Simulators
Over the past few weeks I’ve worked on a number of projects that have necessitated me working with HTML and JavaScript be that via Safari on iOS, an SFSafariViewController, or in an embedded WKWebView. In all of these cases, I’ve needed to dive into the DOM to see what styles are being applied to certain elements or dig into a JavaScript Console to work out why some code isn’t working. On desktop, this is trivial as Safari has a Web Inspector panel built in similar to other browsers. It turns out it is also trivial on mobile as the exact same tool can be used with both iOS simulators and physical devices.

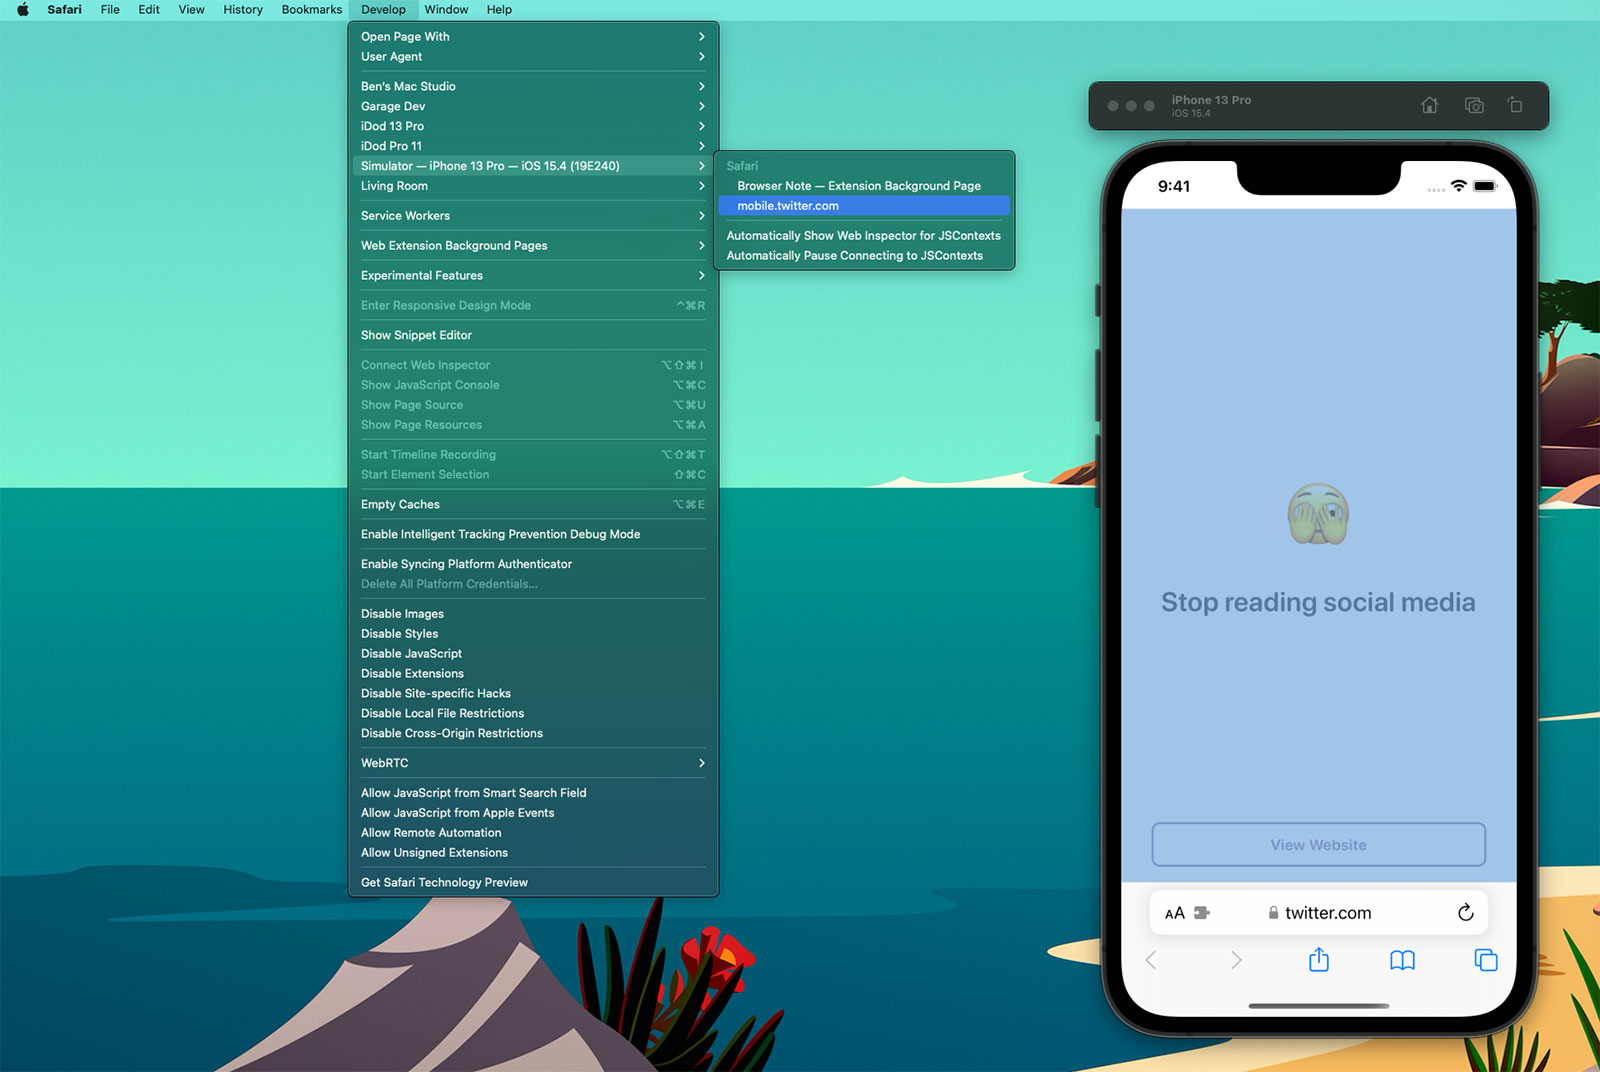
If you select the ‘Develop’ tab from the menu bar of Safari on macOS, you’ll see a list of all of your connected devices and actively running simulators1. Drilling into this will then show all of the active web instances you can interact with; notice how the content within Safari has highlighted blue within the Simulator as I’ve moused over the twitter.com web instance above. When you click, a web inspector panel is then produced which allows you to make all the usual interrogations and changes you can within desktop Safari such as interacting with the console or changing CSS values of elements to see how they would look in realtime.
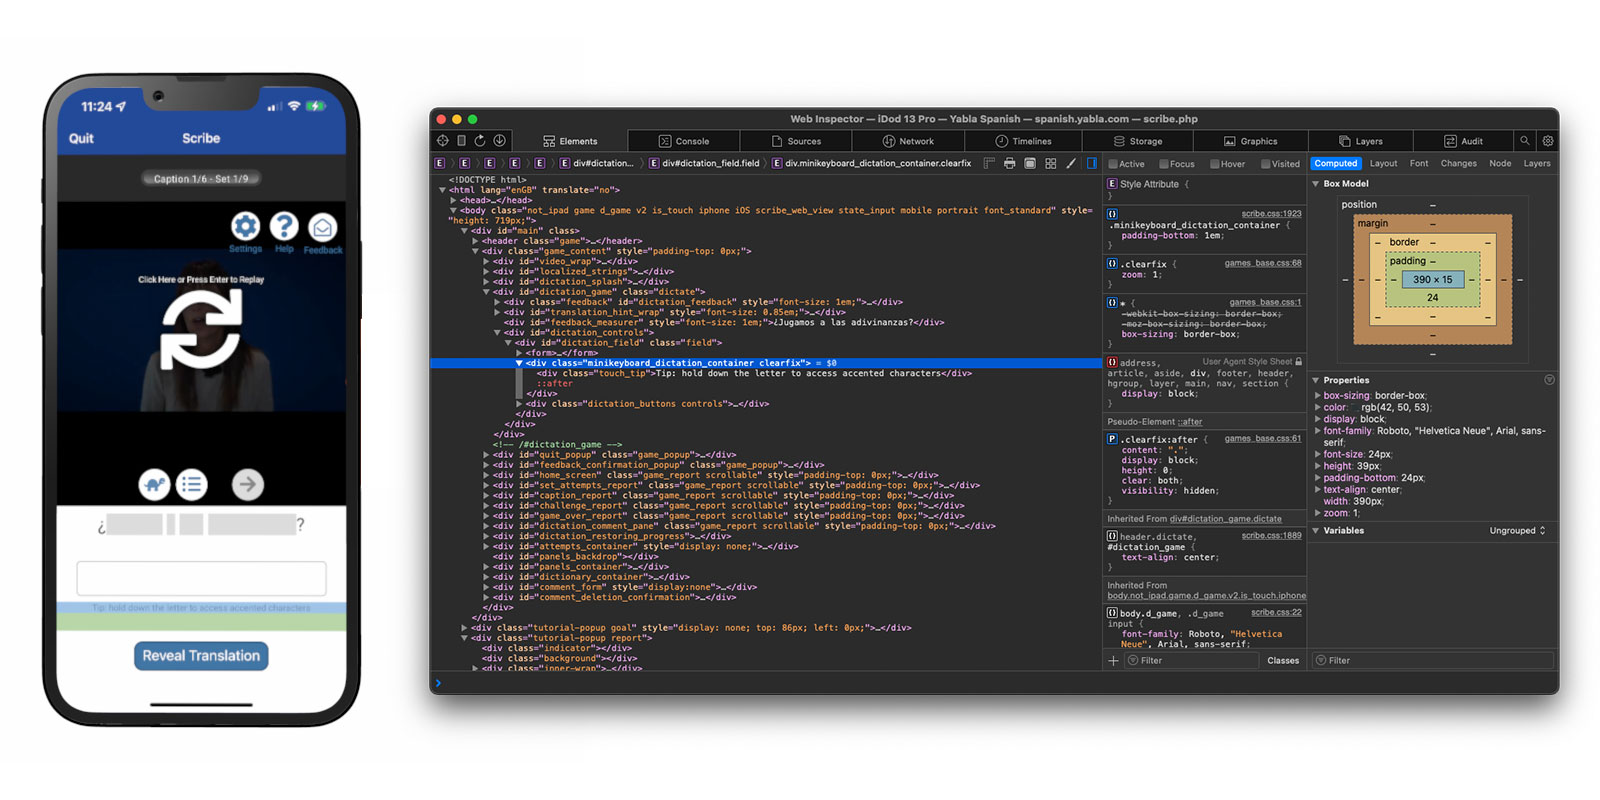
Here’s an example using a WKWebView within one of my client projects, Yabla Spanish:

Discovering that simulators and devices could be interacted with in this way has been a huge timesaver for me. Whilst developing Browser Note, I was constantly needing to tweak CSS values and investigate the current state of the DOM as websites have various tricks to try and make ads or cookie notices appear on top of all content (and the note needed to be on top at all times - you should totally take a look at Browser Note whilst you’re here). In doing this, I was then able to put this knowledge to use on no less than 3 client projects in the past month; this validates my theory that by working on your own side projects you can improve your efficiency when it comes to work projects.
There are a few caveats to be aware of when using the Web Inspector with an iOS device or simulator:
- If you want to use this on an actual device you’ll first need to enable the Web Inspector on iOS. To do this, go to the Settings app and then Safari > Advanced and toggle the Web Inspector on.
- Whilst the Web Inspector can interrogate WKWebView, it can only do this for apps you are running via Xcode. You cannot look at the WKWebView of apps you did not create nor of your own apps from TestFlight / the App Store. However, you can inspect debug builds installed via Xcode even if the debugger is not active (i.e. you build to the device then quit Xcode).
- Conversely, you can use the Web Inspector with any SFSafariViewController even if it is not in your own app.
- Whilst it is still possible to submit apps that use UIWebView, the web inspector will not work with them; it needs to be WKWebView.
- This also works for AppKit, SwiftUI, and Catalyst apps on macOS.
-
I use an “iDod” naming prefix for all of my devices; a throwback pun to my first Apple product, the iPod. ↩︎